CreativeWear is a European project whose objective was, among others, to define and evaluate the interactions between the textile and fashion industry and the creative and cultural industries in order to drive innovative changes in the management of organisations and in regional innovation systems.
Once the analysis was completed, the CreativeWear research team contacted us to help them develop formats that would facilitate the communication of the results achieved.
The challenge consisted in transforming a long, dense report with a terminology that was not always simple, into a format that would reach a set of actors involved in the project with very different profiles (designers, public managers, entrepreneurs, technicians, etc.)
TRANSLATION OF A TECHNICAL REPORT INTO A VISUAL AND ATTRACTIVE SYSTEM
Our first task was to read not only the nearly 200-page final report, but also other materials that the research team had produced during the project (progress reports, presentations, etc.).
Once we were familiarised ourselves with the content and results of the research, we drew up a content summary with the main messages and results that, in our opinion, should be disseminated.
After presenting them to those responsible for research, the final contents to be communicated were specified.
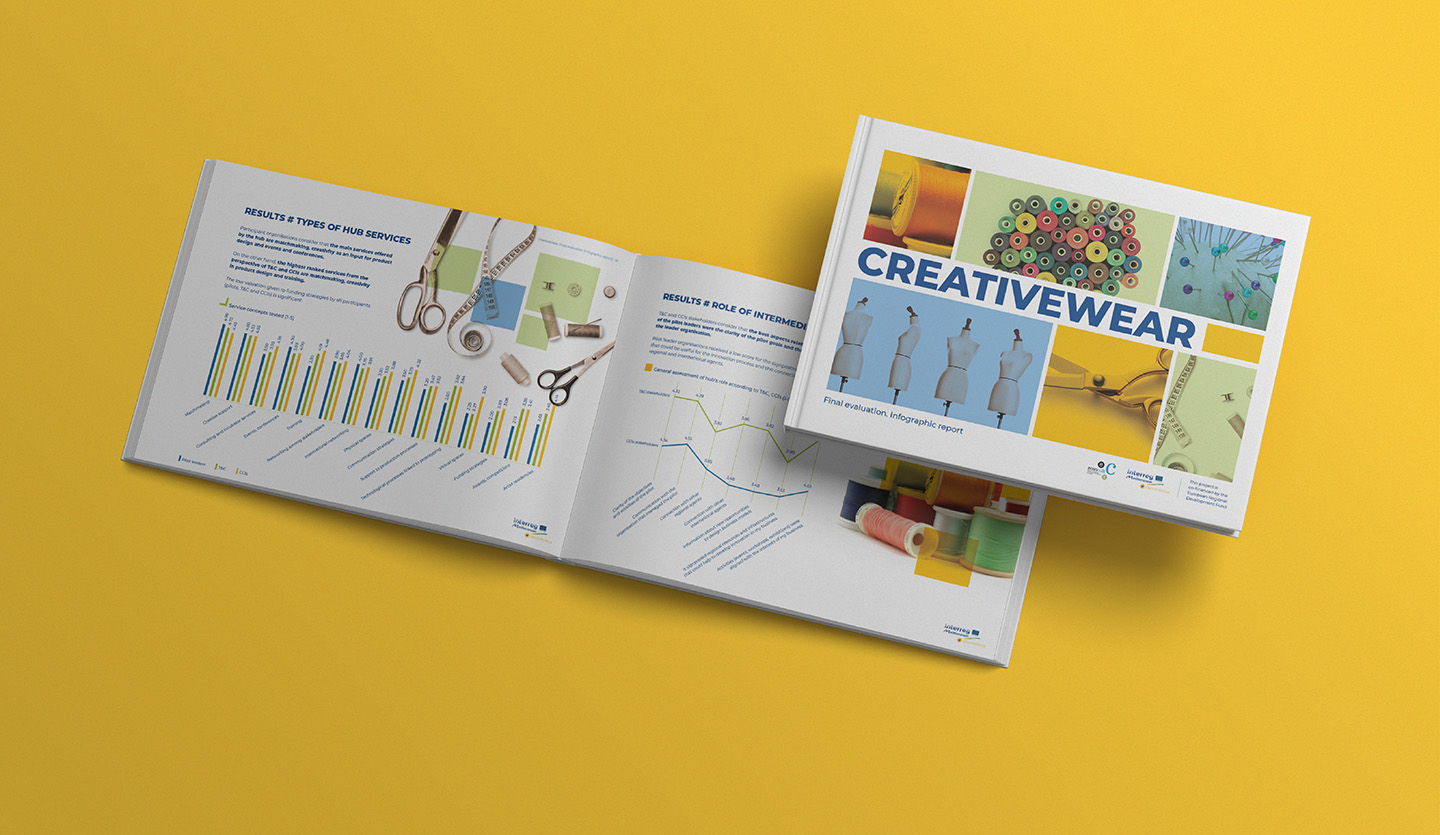
Finally, and after knowing the dynamics that the project was going to use to disseminate the results of the research, we proposed two formats: infographic included in an insert and an infographic report.
INFOGRAPHIC
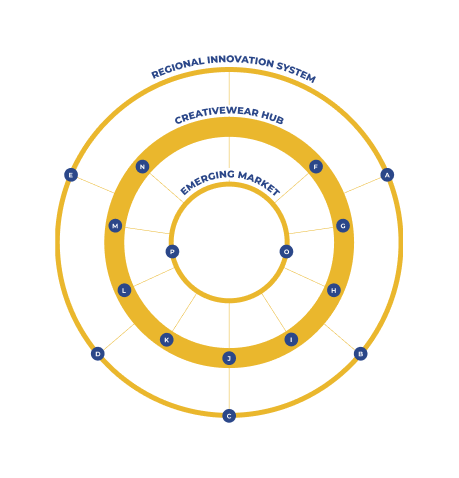
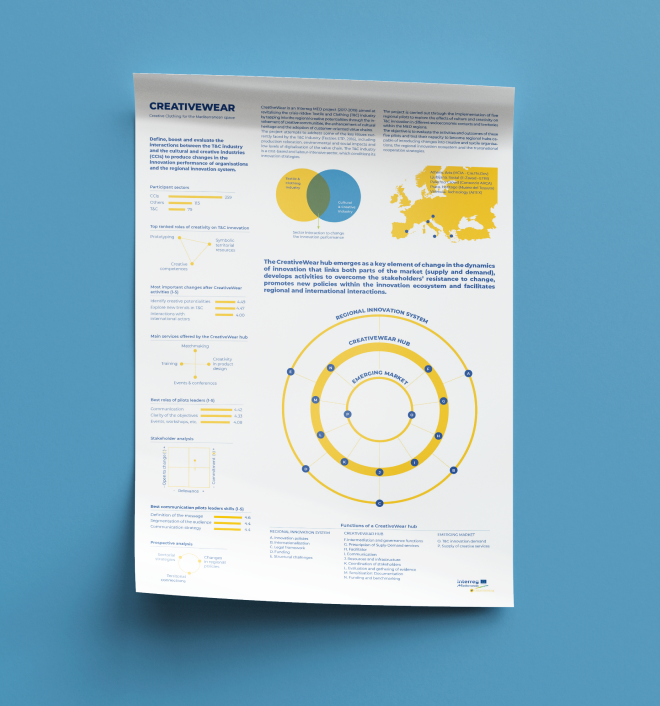
An infographic was designed to allow a first synthetic and global approach to the results of the project. The infographic was designed as an insert, so that any member of the consortium could download the file and print copies to be used as a support element in the events that were to be held to disseminate the results.
INFOGRAPHIC
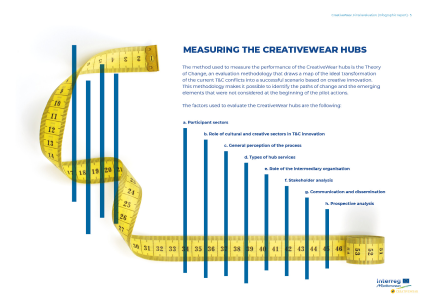
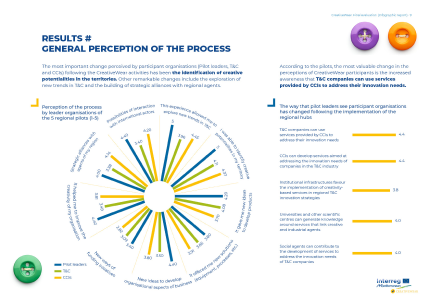
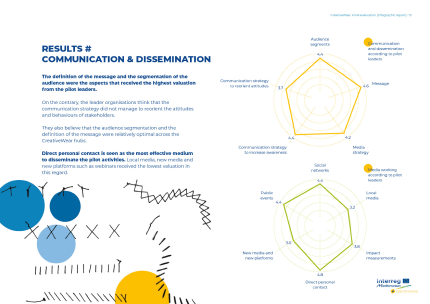
INFOGRAPHIC REPORT
In order to provide more detailed information on the results, without the need to read the whole report, an infographic report was produced, characterised mainly by a limited length, a very visual appearance, with headlines providing clear and concise messages, and some small supporting texts.