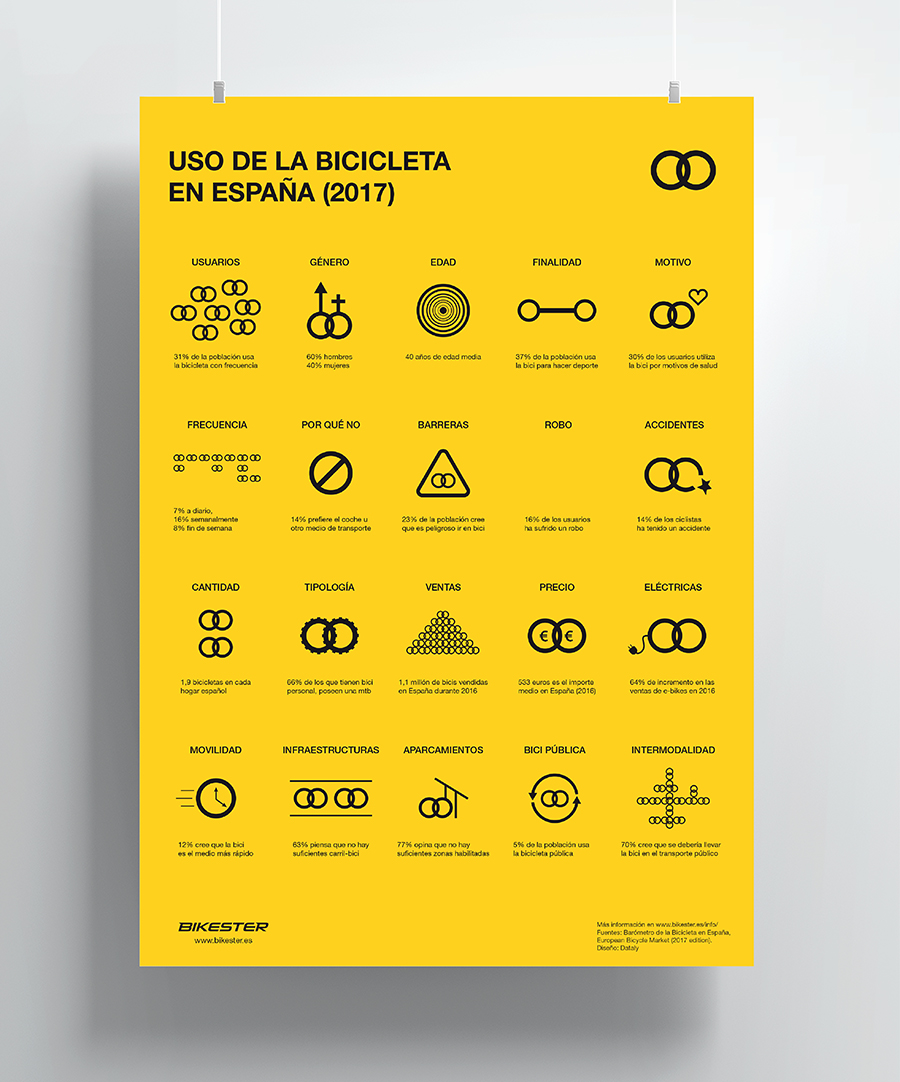
This infographic shows the main results of the Spanish Bicycle Barometer and other reports. This information design project, carried out for Bikester, involve different phases: search for complementary information to the barometer, data analysis, writing an extensive article for the Bikester website and the production of an infographic.