Author name: displaynone

FLORENCE NIGHTINGALE, ANDRÉ GUERRY AND POLAR AREA GRAPHICS

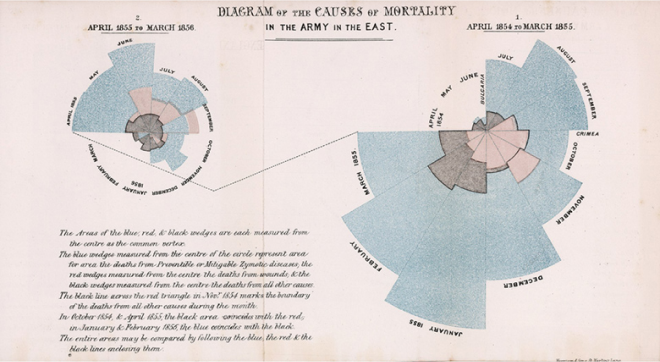
One of the best-known graphs in the history of data visualisation is the “rose diagram” that the nurse and statistician Florence Nightingale designed for her study of the mortality of British troops in the Crimean War in 1856. What fewer people know, however, is that she was not the creator of this chart. Nightingale used …

FLORENCE NIGHTINGALE, ANDRÉ GUERRY AND POLAR AREA GRAPHICS Read More »

WILLIAM PLAYFAIR, THE INVENTOR OF GRAPHS AND DATA VISUALISATION

The Scottish engineer and economist William Playfair (1759-1823) is considered the father of statistical graphs. He pioneered the use of the line graph to represent time series and was the creator of the bar chart and the pie chart. Playfair’s life was punctuated by many vicissitudes as befitting the times he lived in. He carried …

WILLIAM PLAYFAIR, THE INVENTOR OF GRAPHS AND DATA VISUALISATION Read More »

Aviso legal