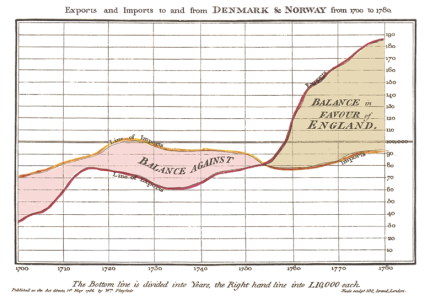
The Scottish engineer and economist William Playfair (1759-1823) is considered the father of statistical graphs. He pioneered the use of the line graph to represent time series and was the creator of the bar chart and the pie chart. Playfair’s life was punctuated by many vicissitudes as befitting the times he lived in. He carried out numerous activities (engraver, engineer, property speculator, journalist, newspaper editor, economist, author of treatises) towards the end of his life, until he began to write. The result of this activity is The Commercial and Political Atlas (1786), considered the first work of graphic representation of data. This statistical atlas uses 43 line charts and a bar chart. He would later publish The Statistical Breviary (1801), where pie charts and pie charts would appear for the first time.
Beyond designing the basic graphs used today in any statistical work, this Scottish engineer laid the foundations of data visualisation. An example of this is this reflection he made on the functionality of graphs:
A good graph provides a better explanation of the facts than a list of data or tables. It serves to simplify the complex, allows the brain greater retention and is a visual aid to busy men. Finally, graphs allow us to see seemingly non-existent relationships between variables, which are often hidden in the multitude of facts and figures, otherwise difficult to compare.
From his words, which are extremely topical, the following elements should be highlighted:
Simplify the complex. The main function of the graph is to create an abstraction that allows us to simplify a complex information or data set. This must be taken into account both in the elaboration of graphs and in infographics or other data visualisations. Nowadays it is common to see that many graphs are “littered” with too many artificial elements that hinder the process of simplification and transmission of information.
Seeing seemingly non-existent relationships. Another of the great functions of the graph is to reveal relationships between a set of data that cannot be detected through a table. On many occasions a graph is a revealing image.
It allows for greater retention. It has been proven that the image communicates more than text. The connection between image (graphic) and text (message) has a communicative power that is difficult to surpass. Unfortunately, it has not yet been exploited to its full potential.
Helping busy men. Visual communication is the format of the present and the future for the transmission of information. Partly due to the limited time we have to assimilate information. Graphics, as a visual element that summarises specific information, is a fundamental tool in this dynamic.
William Playfair undoubtedly understood the importance of data visualisation and the transcendence it would have on communication. One more example of an enlightened era that did so much for the advancement and dissemination of knowledge.